Kubernetes 리소스 모니터링 (1) - Prometheus
현재 Weasel 프로젝트를 클라우드 환경에서 온프레미스로 마이그레이션하는 작업을 진행하고 있습니다. Prometheus와 Grafana를 사용해 Kubernetes Cluster의 리소스 모니터링 시스템을 구축하는 과정을 공유해보도록 하겠습니다.
관련 글
- Kubernetes 리소스 모니터링 (1) - Prometheus (현재 글)
- Kubernetes 리소스 모니터링 (2) - Grafana
- Kubernetes 리소스 모니터링 (3) - Prometheus & Grafana 연동
- Kubernetes 리소스 모니터링 (4) - Prometheus & Thanos 연동
1. Prometheus란?
Prometheus는 오픈소스 모니터링 및 알림 시스템으로, 주로 클라우드 네이티브 애플리케이션과 인프라의 상태를 모니터링하는 데 사용됩니다. 2012년 SoundCloud에서 처음 개발되었으며 현재는 Cloud Native Computing Foundation(CNCF)에 의해 관리되고 있습니다. Prometheus는 Kubernetes와 같은 컨테이너 오케스트레이션 플랫폼의 모니터링을 위한 사실상의 표준으로 자리 잡았습니다.
2. Prometheus의 특징
- 데이터 모델: 모든 메트릭 데이터는 이름과 레이블(label)로 식별되는 시계열 형태로 수집합니다.
- PromQL: 시계열 데이터를 실시간으로 분석하고 집계할 수 있는 강력한 쿼리 언어를 사용합니다.
- 독립 실행형 서버 및 스토리지: 외부 종속성 없이 자체적인 스토리지 엔진을 사용하여 데이터를 효율적으로 저장하고 관리합니다.
- Pull 방식의 데이터 수집: 모니터링 대상(Target)으로부터 직접 메트릭을 가져오는 Pull 모델을 사용합니다.
- Alerting: Alert Manager를 통해 조건에 따른 알림을 설정하고, 이메일, 슬랙 등 다양한 채널로 알림을 전송할 수 있습니다.
- 시각화 도구와 연동: Grafana 등과 같은 시각화 도구와 쉽게 통합되어 대시보드를 구성하고 모니터링 데이터를 시각적으로 분석할 수 있습니다.
3. Prometheus의 구성요소
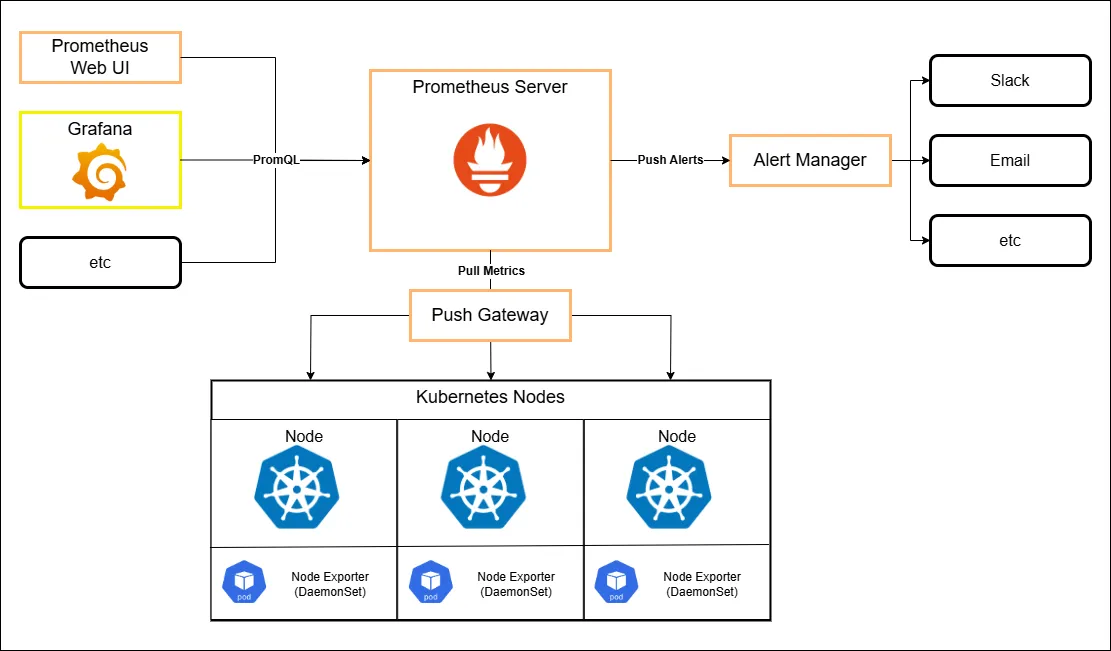
- Prometheus Server: 메트릭 데이터를 Pull 방식으로 수집하고 시계열 데이터베이스에 저장합니다.
- Node Exporter: 각 Kubernetes Node에 DaemonSet 형태로 배포되어 시스템 메트릭을 수집합니다.
- Push Gateway: 단발성 작업(Job)과 짧은 수명의 애플리케이션에서 메트릭을 Prometheus Server에 Push할 수 있도록 도와줍니다.
- Alert Manager: Prometheus Server에서 생성된 경고를 받아 연동된 알림 채널로 전달합니다.
- Prometheus Web UI: PromQL 쿼리를 실행하고 메트릭을 확인할 수 있는 내장 Web UI입니다.
4. Prometheus 구축 - Helm
실습 환경은 아래와 같습니다.
Kubernetes (v1.29.6)
Helm (v3.16.2)
StorageClass (rancher.io/local-path)
4.1. prometheus-community Helm Chart Repository 추가
1
2
❯ helm repo add prometheus-community https://prometheus-community.github.io/helm-charts
"prometheus-community" has been added to your repositories
4.2. namespace 생성
prometheus와 grafana가 생성될 monitoring namespace를 생성합니다.
1
2
❯ kubectl create ns monitoring
namespace/monitoring created
4.3. Prometheus Helm Chart 배포
현재 사용 중인 StorageClass를 사용하셔야 합니다
kubectl get sc명령어로 StorageClass 이름을 확인할 수 있습니다.
1
2
3
4
5
6
7
8
9
10
11
12
13
14
15
16
17
18
19
20
21
22
23
24
25
26
27
28
29
30
31
32
33
34
35
36
37
38
39
❯ helm install prometheus prometheus-community/prometheus \
    --namespace monitoring \
    --set alertmanager.persistence.storageClass="{StorageClassName}" \
    --set server.persistentVolume.storageClass="{StorageClassName}"
NAME: prometheus
LAST DEPLOYED: Fri Nov  8 18:46:00 2024
NAMESPACE: monitoring
STATUS: deployed

...
...

The Prometheus server can be accessed via port 80 on the following DNS name from within your cluster:
prometheus-server.monitoring.svc.cluster.local


Get the Prometheus server URL by running these commands in the same shell:
  export POD_NAME=$(kubectl get pods --namespace monitoring -l "app.kubernetes.io/name=prometheus,app.kubernetes.io/instance=prometheus" -o jsonpath="{.items[0].metadata.name}")
  kubectl --namespace monitoring port-forward $POD_NAME 9090


The Prometheus alertmanager can be accessed via port 9093 on the following DNS name from within your cluster:
prometheus-alertmanager.monitoring.svc.cluster.local


Get the Alertmanager URL by running these commands in the same shell:
  export POD_NAME=$(kubectl get pods --namespace monitoring -l "app.kubernetes.io/name=alertmanager,app.kubernetes.io/instance=prometheus" -o jsonpath="{.items[0].metadata.name}")
  kubectl --namespace monitoring port-forward $POD_NAME 9093

...
...

The Prometheus PushGateway can be accessed via port 9091 on the following DNS name from within your cluster:
prometheus-prometheus-pushgateway.monitoring.svc.cluster.local


Get the PushGateway URL by running these commands in the same shell:
  export POD_NAME=$(kubectl get pods --namespace monitoring -l "app=prometheus-pushgateway,component=pushgateway" -o jsonpath="{.items[0].metadata.name}")
  kubectl --namespace monitoring port-forward $POD_NAME 9091
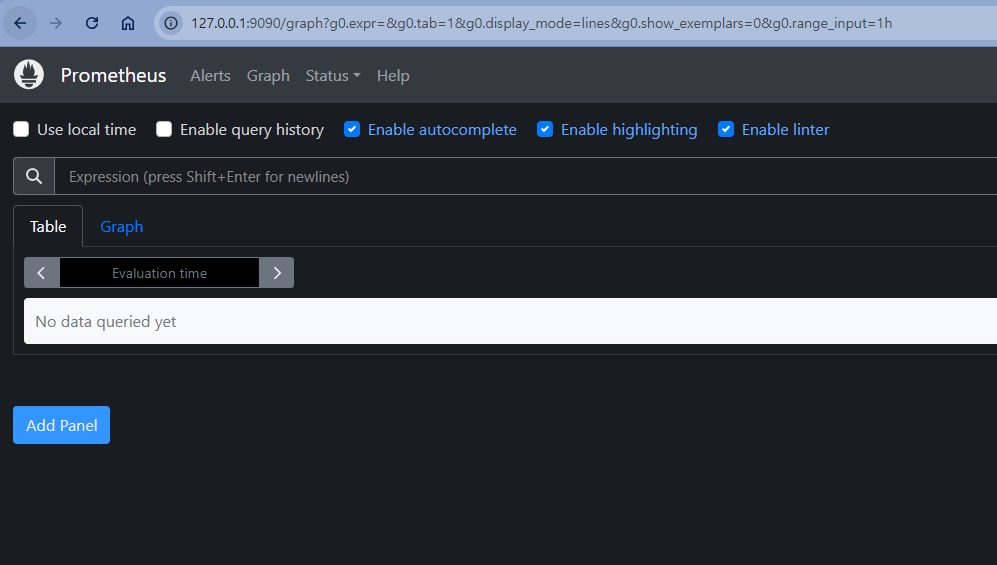
4.4. 확인 (Prometheus Server)
1
2
3
4
5
6
❯ export POD_NAME=$(kubectl get pods --namespace monitoring -l "app.kubernetes.io/name=prometheus,app.kubernetes.io/instance=prometheus" -o jsonpath="{.items[0].metadata.name}")
  kubectl --namespace monitoring port-forward $POD_NAME 9090
Forwarding from 127.0.0.1:9090 -> 9090
Forwarding from [::1]:9090 -> 9090
Handling connection for 9090
Handling connection for 9090
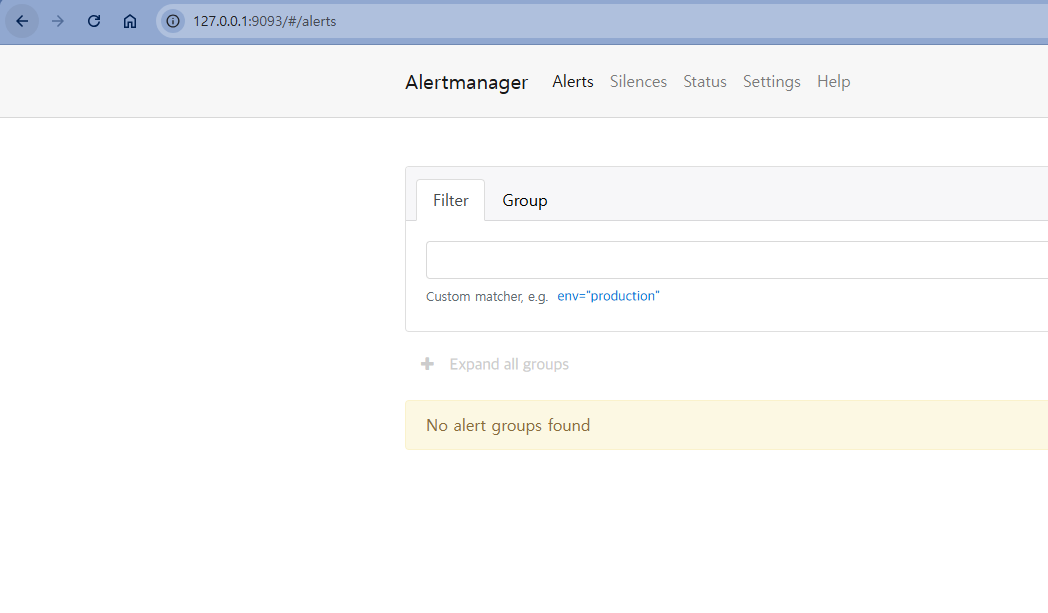
4.5. 확인 (Prometheus Alert Manager)
1
2
3
4
5
6
❯ export POD_NAME=$(kubectl get pods --namespace monitoring -l "app.kubernetes.io/name=alertmanager,app.kubernetes.io/instance=prometheus" -o jsonpath="{.items[0].metadata.name}")
  kubectl --namespace monitoring port-forward $POD_NAME 9093
Forwarding from 127.0.0.1:9093 -> 9093
Forwarding from [::1]:9093 -> 9093
Handling connection for 9093
Handling connection for 9093
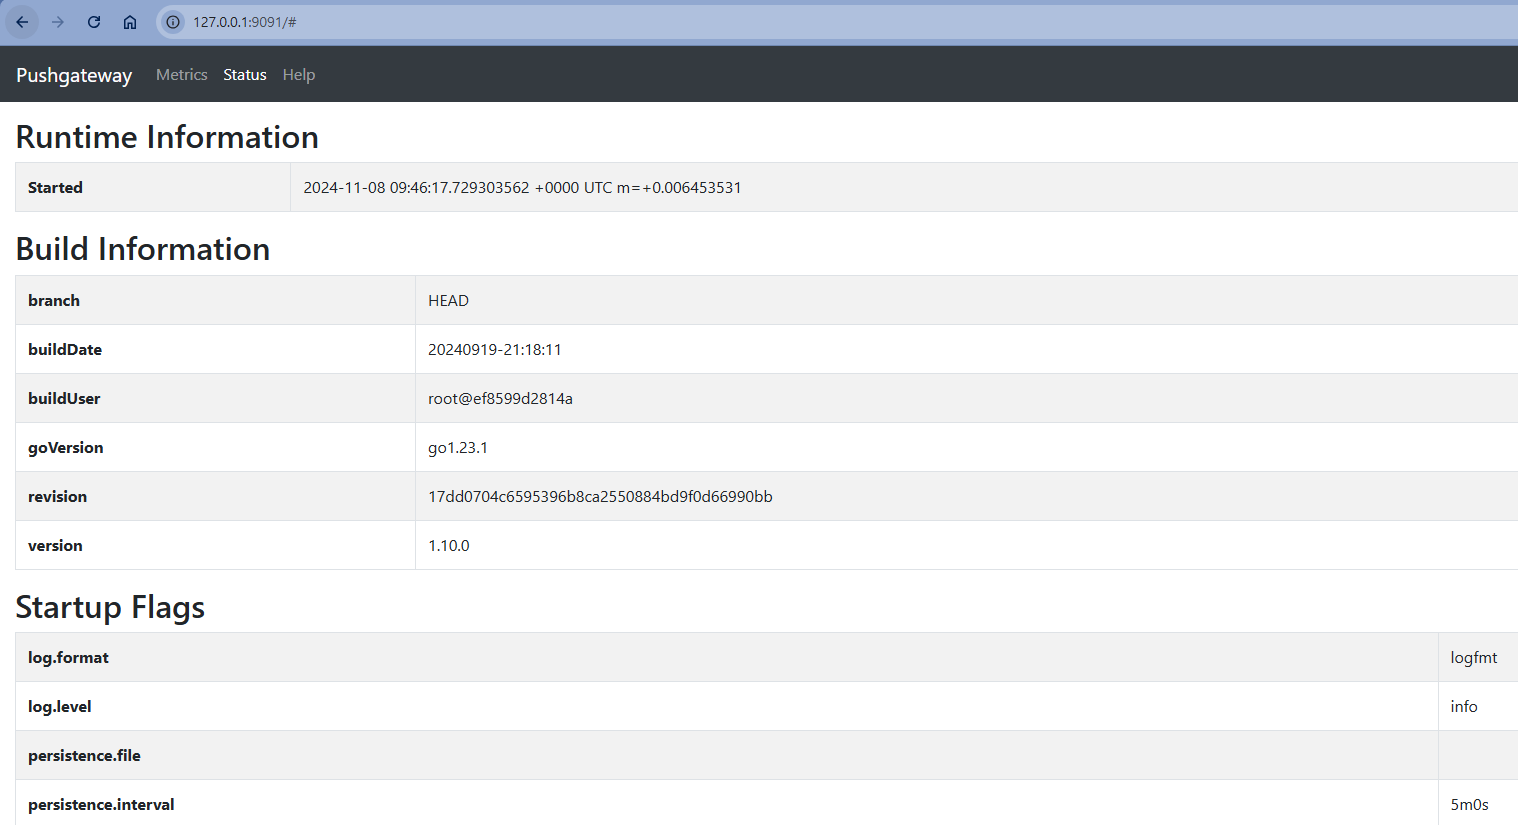
4.6. 확인 (Prometheus Push Gateway)
1
2
3
4
5
6
7
❯ export POD_NAME=$(kubectl get pods --namespace monitoring -l "app.kubernetes.io/name=prometheus-pushgateway" -o jsonpath="{.items[0].metadata.name}")
kubectl --namespace monitoring port-forward $POD_NAME 9091

Forwarding from 127.0.0.1:9091 -> 9091
Forwarding from [::1]:9091 -> 9091
Handling connection for 9091
Handling connection for 9091
5. Reference
Prometheus 공식문서 - https://prometheus.io/docs/introduction/overview
Prometheus Helm Chart - https://github.com/prometheus-community/helm-charts
궁금하신 점이나 추가해야 할 부분은 댓글이나 아래의 링크를 통해 문의해주세요.
Written with KKamJi